
The American Customer Satisfaction Index (ACSI®): Quarter 1, 2026
Customer Satisfaction Weakens: Pent-Up Defection Intensifies
-
Customer satisfaction stagnating despite massive investment.
Since 2013, US companies have spent over $500 billion on CX related initiatives – with no detectable return.
-
Pent-up customer defection is brewing.
If realized, the repercussions could be disastrous for many companies.
-
The nightmare scenario can be prevented.
Investments in CX should be redirected toward performance metrics that matter for revenue and profit growth, along with enhanced analytics for efficient resource allocation. What is used today is not up to the task.
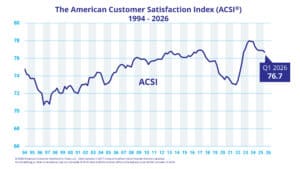
In the first quarter of 2026, the American Customer Satisfaction Index (ACSI®) fell 0.3% to a score of 76.7 (100-point scale) on an annual basis. After an upward drift during the first 13 years of this century, customer satisfaction became more volatile, but without directionality, during the next 13 years (through Q1 2026). The current national ACSI score is the same as it was in 2013. Around that time, the economy settled into a lower growth phase — decoupling changes in quality of economic output (ACSI) from quantity of economic output (GDP). Markets gradually became more concentrated, with sellers gaining market power. Equity markets became exceptionally concentrated, with negative repercussions for stock returns in consumer sectors relative to business-to-business, especially in technology. Measures of Customer Experience (Forrester) and Consumer Sentiment (University of Michigan) reached their lowest levels ever.
 Estimates about how much has been invested to improve customer satisfaction/customer experience over the years vary, but it appears to be well over $100 billion annually with no detectable returns. If anything, the returns have been negative. Customer complaints have now reached record levels, surging by 16% in the first quarter. Paradoxically and contrary to what occurs in efficient markets, customer retention has increased. Accordingly, corporate profits soared. First quarter earnings were up by 15% — even more than the revenue increase. Most of the profit margin growth was in business-to-business, but many consumer-facing sectors also did well.
When customers come back for more — even if they are less than satisfied — pent-up defection, the inverse of pent-up demand, intensifies. When realized, the cost is the future revenue and profit lost, plus the additional expenditure for replacing departed customers. It is the flipside of the value escalation from customer retention growth — where loyal customers generate multiplicative, and at high levels of retention, exponential revenue growth. Profits improve even more than revenue because the marginal cost of keeping a customer is usually lower than the corresponding customer acquisition cost. Accordingly, the financial penalty for losing customers is extraordinarily high: Spirit Airlines, Sears, and JCPenney can testify to that. Reduced upsell opportunity, which also tends to encourage competitive inroads, is another causality associated with pent-up customer defection.
A customer’s ability to defect can be thwarted by various degrees of seller monopoly power and high customer switching costs. For companies in competitive markets, the probability of defection is minimized by making sure that customers are satisfied. Customer satisfaction-produced retention turns the dogma of “high risk/high return” into “low risk/high return.” To get there, however, the currently used methods for strengthening customer relationships will not do: analytics cannot be incompatible with the properties of customer data (extreme multicollinearity, non-normal frequency distributions, and high measurement error). The performance metrics must be profit relevant (unlike many now) and they should not produce more noise than signal — which is often the case today. They should be calibrated to maximize customer retention and deliver casual information on how to best allocate resources for it. It is in customer retention that the financial return lies, and it is sizeable. Both economic growth and consumer utility would be beneficiaries, as would long-term profitability.
Claes Fornell, the Donald C. Cook Distinguished Professor of Business (Emeritus) at the University of Michigan, is the primary author of this press release. According to Google Scholar, Professor Fornell is the most cited person in the world on customer satisfaction and one of the most cited econometricians/statisticians with respect to structural equation models with unobservable variables and measurement error. He holds honorary doctorates from several universities.
| 1st Quarter | 2nd Quarter | 3rd Quarter | 4th Quarter | |
|---|---|---|---|---|
| 2026 | 76.7 | – | – | – |
| 2025 | 77.0 | 76.9 | 76.9 | 76.9 |
| 2024 | 78.0 | 77.9 | 77.9 | 77.3 |
| 2023 | 75.4 | 76.7 | 77.1 | 77.8 |
| 2022 | 73.1 | 73.0 | 73.5 | 74.4 |
| 2021 | 73.9 | 73.8 | 73.5 | 73.1 |
| 2020 | 74.3 | 74.1 | 73.9 | 73.6 |
| 2019 | 75.6 | 75.7 | 75.7 | 75.2 |
| 2018 | 76.7 | 76.2 | 75.9 | 75.6 |
| 2017 | 76.6 | 76.9 | 76.9 | 76.9 |
| 2016 | 76.3 | 76.2 | 76.4 | 76.7 |
| 2015 | 76.2 | 76.1 | 76.1 | 76.1 |
| 2014 | 76.5 | 76.4 | 76.5 | 76.5 |
| 2013 | 76.6 | 76.5 | 76.7 | 76.8 |
| 2012 | 75.9 | 75.9 | 75.9 | 76.3 |
| 2011 | 75.6 | 75.7 | 75.7 | 75.8 |
| 2010 | 75.9 | 75.9 | 75.7 | 75.3 |
| 2009 | 76.0 | 76.1 | 76.0 | 75.9 |
| 2008 | 75.2 | 75.1 | 75.0 | 75.7 |
| 2007 | 75.2 | 75.3 | 75.2 | 74.9 |
| 2006 | 74.1 | 74.4 | 74.4 | 74.9 |
| 2005 | 73.0 | 73.1 | 73.2 | 73.5 |
| 2004 | 74.4 | 74.4 | 74.3 | 73.6 |
| 2003 | 73.8 | 73.8 | 73.8 | 74.0 |
| 2002 | 73.0 | 73.0 | 73.1 | 72.9 |
| 2001 | 72.2 | 72.1 | 72.0 | 72.6 |
| 2000 | 72.5 | 72.8 | 72.9 | 72.6 |
| 1999 | 72.1 | 72.0 | 72.1 | 72.8 |
| 1998 | 71.9 | 72.2 | 72.3 | 72.6 |
| 1997 | 70.7 | 71.1 | 71.1 | 70.8 |
| 1996 | 73.0 | 72.4 | 72.2 | 72.0 |
| 1995 | 74.1 | 73.7 | 73.7 | 73.7 |
| 1994 | – | – | 74.8* | 74.2 |
*Baseline measurement taken in summer 1994
While companies today have more data about their customers, the analytics employed to turn data into information are for the most part not good enough. Customer satisfaction data have certain characteristics that make it difficult to obtain accurate estimates, to pinpoint what aspects of the customer experience need attention, and to gauge the financial impact of actions contemplated. Traditional statistical methods assume normal frequency distributions among the residuals, moderate multicollinearity, and low levels of data noise. Customer satisfaction data don’t meet these assumptions.
ACSI Analytics is designed to overcome these problems and thereby turning raw data into financially relevant information by:
- Separating signals from noise
- Moving from correlations and artificial intelligence (AI) patterns to cause-and-effect interpretations
- Calibrating measurement instruments toward profitability
Data is not the same as information—especially not data from consumer surveys. Management decisions require information; raw data must be filtered in order to be useful for decision-making. ACSI technology filters out data noise.
Management decisions require cause-and-effect information—something that current CX tools, whether based on AI or descriptive statistics, don’t provide. ACSI Analytics, on the other hand, is based on a causal model.
There is a wide disparity in the amount of consumer data collected by companies today. Some data suppliers use surveys with more than 200 questions per respondent, while others focus on responses to a single question. Neither is appropriate. Excessively long surveys may lead to straight-line responses. Good measurement techniques—whether in the social or physical sciences—typically require several measures (survey questions in this case) per product feature or service dimension.
Accuracy and relevance are what matters. To contribute to the business objectives at hand, the measurement instruments need calibration in ways similar to the physical sciences. This is why companies with high scores in the American Customer Satisfaction Index, which is calibrated to maximize customer loyalty, are financially successful, most notably in terms of stock returns and profitability.
No advertising or other promotional use can be made of ACSI data and information without the express prior written consent of ACSI LLC.