ANN ARBOR, Mich. (May 22, 2018) – Customer satisfaction with video streaming services far eclipses that of subscription TV service, according to the American Customer Satisfaction Index (ACSI®) 2018 Telecommunications Report. Video streaming services make their debut in this year’s telecom report with an ACSI score of 75, far and above subscription TV’s score of 62 – a 3.1 percent decline over last year. By nearly every measure, customers are more satisfied with streaming options, but some brands stand out more than others.
“Video streaming services significantly outperformed subscription TV,” said David VanAmburg, Managing Director at the ACSI. “Streaming services don’t have the hidden fees and six-month rates that subscription TV does, not to mention they’re cheaper and simpler. But because consumers don’t have many options when choosing a subscription TV provider, those businesses don’t see a lot of risk in customer dissatisfaction, and we’re unlikely to see dramatic changes any time soon.”
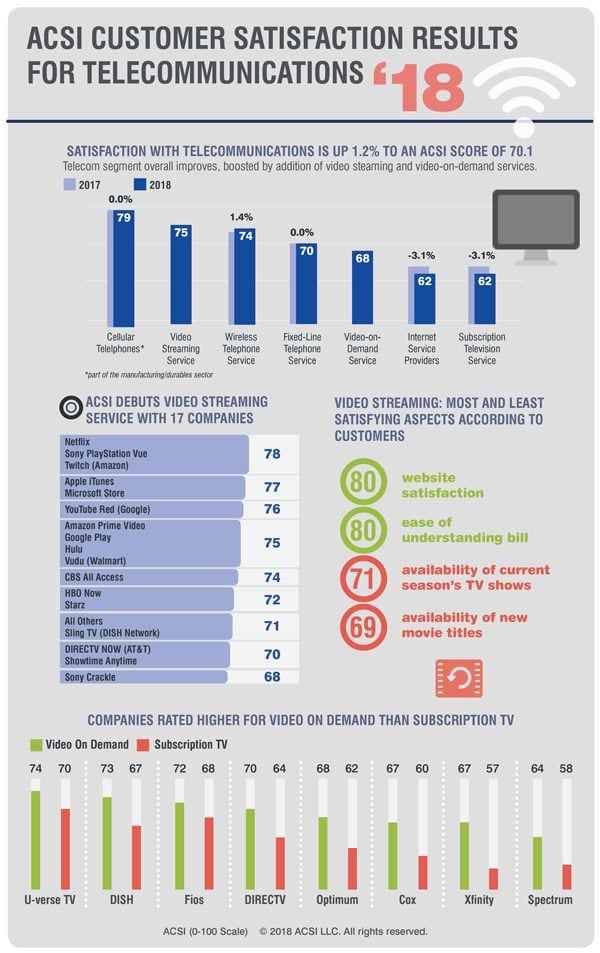
Video streaming services avoid the downsides of other telecom companies
With an ACSI score of 75, video streaming services are the highest-performing telecom industry measured. Netflix, Sony PlayStation Vue, and Twitch all lead the pack, tying at a score of 78. Apple iTunes and the Microsoft Store take second place at 77, with YouTube Red in third at 76.
Amazon Prime Video, Google Play, Hulu, and Vudu all sit at the industry average of 75, followed by the network channel subscriptions: CBS All Access at 74, and HBO Now and Starz at 72.
Bringing up the rear are Sling TV (71), DIRECTV NOW (70), Showtime Anytime (70), and Sony Crackle (68). It’s worth noting that even Sony Crackle in last place rates higher than nearly all subscription TV services.
Video streaming services receive high marks for ease of understanding the bill (80), website satisfaction (80), and call centers (75), but customers ding them on availability of the current season’s TV shows (71) and availability of new movie titles (69).
Subscription TV continues losing ground
Customer satisfaction with subscription TV falls 3.1 percent to 62, an 11-year low for the industry.
AT&T’s U-verse TV tops the list with a 70, one of only two scores that stayed the same instead of dropping. Verizon Fios falls 4 percent year over year to a 68 for second place, while DISH Network holds steady at 67 for third.
In the middle of the pack, DIRECTV and Optimum both fall 6 percent to 64 and 62, respectively. Cox Communications sheds 2 percent to 60, while Spectrum and Suddenlink both plunge 8 percent to 58.
Comcast Xfinity decreases 2 percent to 57, Frontier Communications drops 7 percent to 56, and Mediacom places last with a 55, down 2 percent.
The top-rated part of the subscription TV experience is HD picture quality, which holds steady at a score of 80. Picture quality is close behind, down 1 percent to 78.
While courtesy and helpfulness of store and service center staff have a relatively good score of 77, and speed of store and service center transactions receive a 76, call center satisfaction continues to be the scourge of the industry, slipping 3 percent to 63.
“If you look at retail, airlines, and many other industries, companies like to reward customer loyalty, offering perks or discounts for doing business with them,” said VanAmburg. “Telecom is the exact opposite. In many ways, loyalty is punished because subscription TV is focused on customer acquisition and offering the best deal to lure customers away from competitors. In the long run, that doesn’t leave customers very satisfied.”
Video-on-demand service debuts lower than streaming at an ACSI score of 68
Among video-on-demand services, AT&T’s U-verse TV takes the top spot with a 74, followed by DISH Network at 73, and Verizon Fios at 72. At 70, AT&T’s DIRECTV comes in far below its U-verse offering, but ahead of the industry average.
Optimum leads all cable companies in video on demand at the industry average of 68, while Cox Communications and Xfinity tie at 67, and Spectrum comes in last at 64.
Video-on-demand viewers are pleased with the number of TV shows (75), current seasons (74) and variety by category (74) available. However, the availability of a past season’s shows is lacking (69) as are free on-demand content (69) and new movie titles (68). Call centers receive the lowest marks (67), but call center service performs better for on-demand customers than for internet and subscription TV.
Internet service providers hit an all-time low
While video streaming services receive much better customer satisfaction scores than subscription TV, viewers still need internet access to get it. Unfortunately, internet service providers (ISPs), along with subscription TV, have the lowest customer satisfaction of all industries tracked by the ACSI.
ISPs are down 3.1 percent to 62, and while customers clearly aren’t satisfied with their service, more than half of Americans have only one choice for high-speed broadband. Every major ISP deteriorates this year except Xfinity, which remains unchanged.
Verizon Fios stays in first place at 70 after a 1 percent dip. AT&T Internet also falls 1 percent for a second-place score of 68, followed by Optimum, which drops 6 percent to 64.
Suddenlink and Spectrum both plummet 8 percent to 61 and 60, respectively, followed by Xfinity, unchanged at 60. Mediacom places last with a 53 after a 9 percent free fall year over year.
Call center satisfaction, already low, falls another 3 percent to 59. Customers are also less satisfied with overall data transfer speed, which sinks 3 percent to 67, and the variety of internet plans available, which shed 3 percent to 64. The one bright spot: Courtesy and helpfulness of store and service center staff, and speed of store and service center transactions both rated well, at 76 and 74, respectively, though both are down from last year.
The ACSI Telecommunications Report 2018, includes data on subscription TV services, video streaming, video-on-demand, internet service providers, fixed-line and wireless telephone services, and cell phone manufacturers. It’s based on 45,292 customer surveys collected between April 19, 2017 and March 17, 2018. The full report is available for download here.
This press release is also available in PDF format.