
Government
ACSI measures citizen satisfaction with over 100 services, programs, and websites of federal government agencies
The ACSI model links citizen satisfaction with outcomes of complaints and citizen trust in government.
GOVERNMENT
Government entities use ACSI to track user satisfaction with the quality of their services over time and compare these results to other organizations in both the private and public spheres. ACSI also provides cause-and-effect analysis to help agencies focus resources where improvements will have the most impact.
At a glance:
Government
-
Inaugural year:
1994
-
Updated:
annually
-
Most recent data:
2025
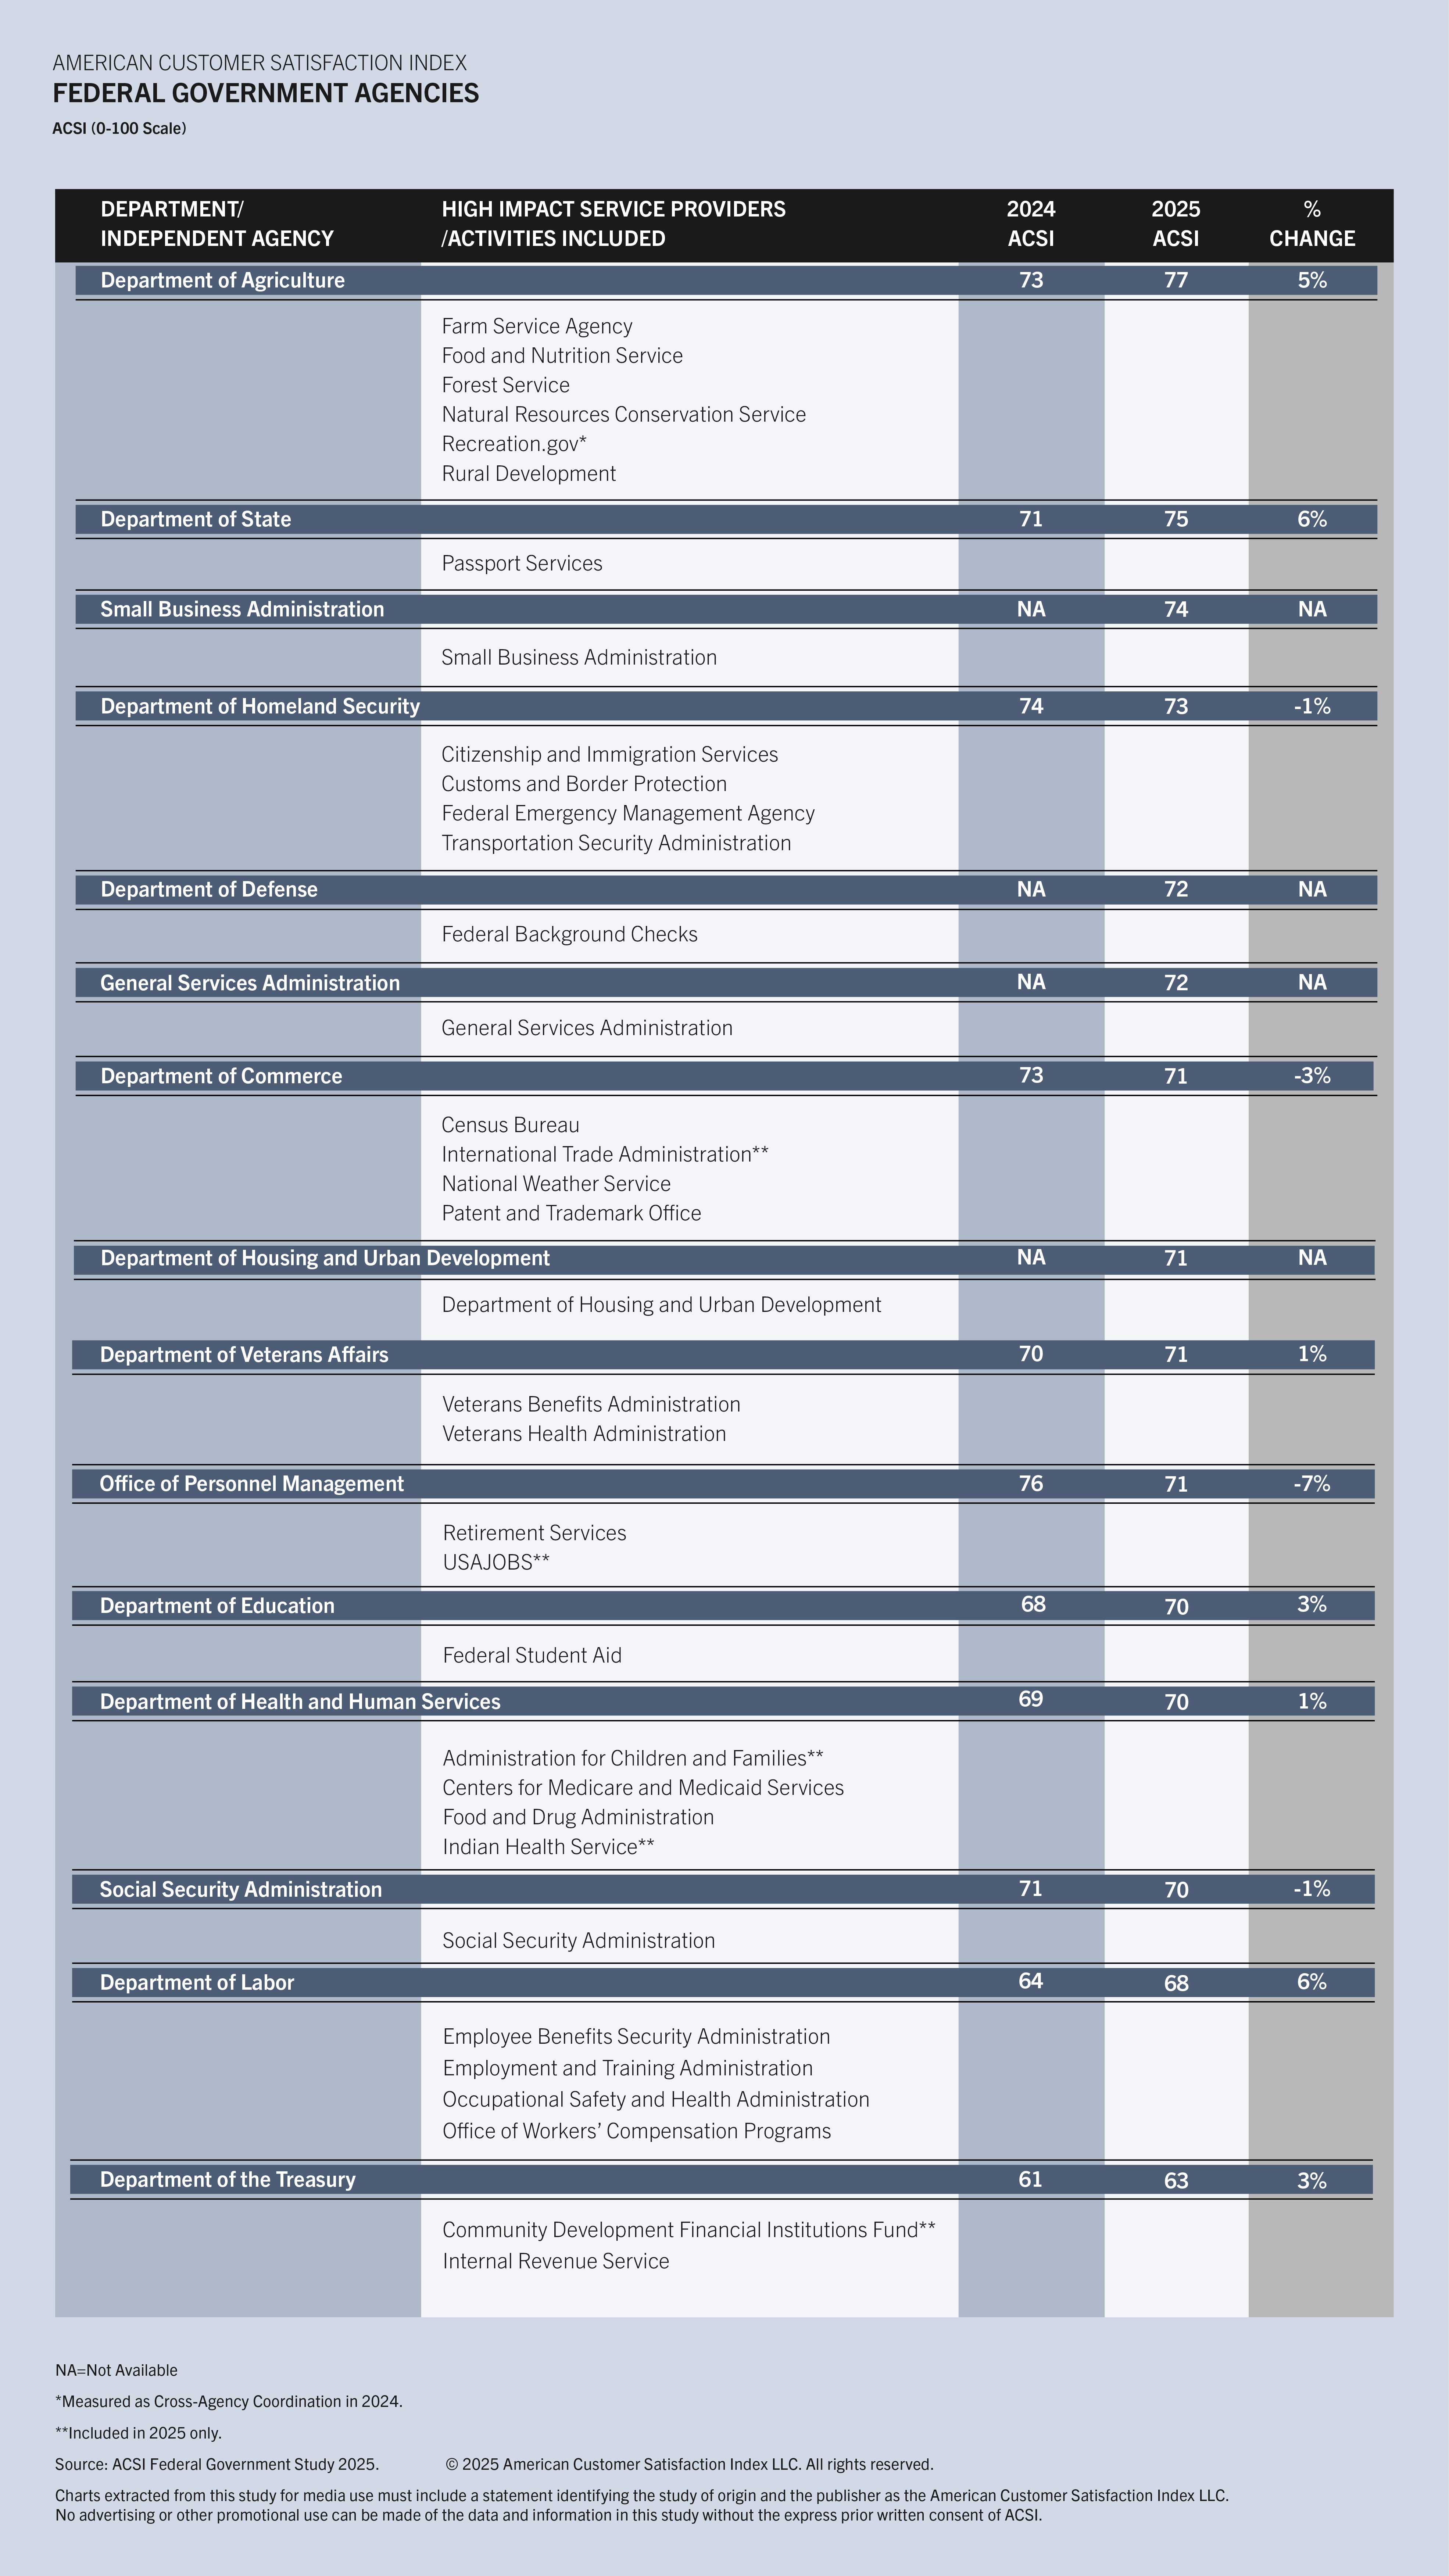
In addition to its extensive coverage of the private sector, the American Customer Satisfaction Index (ACSI) benchmarks citizen satisfaction for a multitude of federal agencies and departments. In 1999, the federal government selected the ACSI to be a standard metric for measuring citizen satisfaction. Now, ACSI coverage of federal government continues to grow through CFI Group, the exclusive partner of the ACSI in the federal government. All told, the ACSI measures citizen satisfaction with over 100 services, programs, and websites of federal government agencies.
Citizen Satisfaction with Federal Government Services
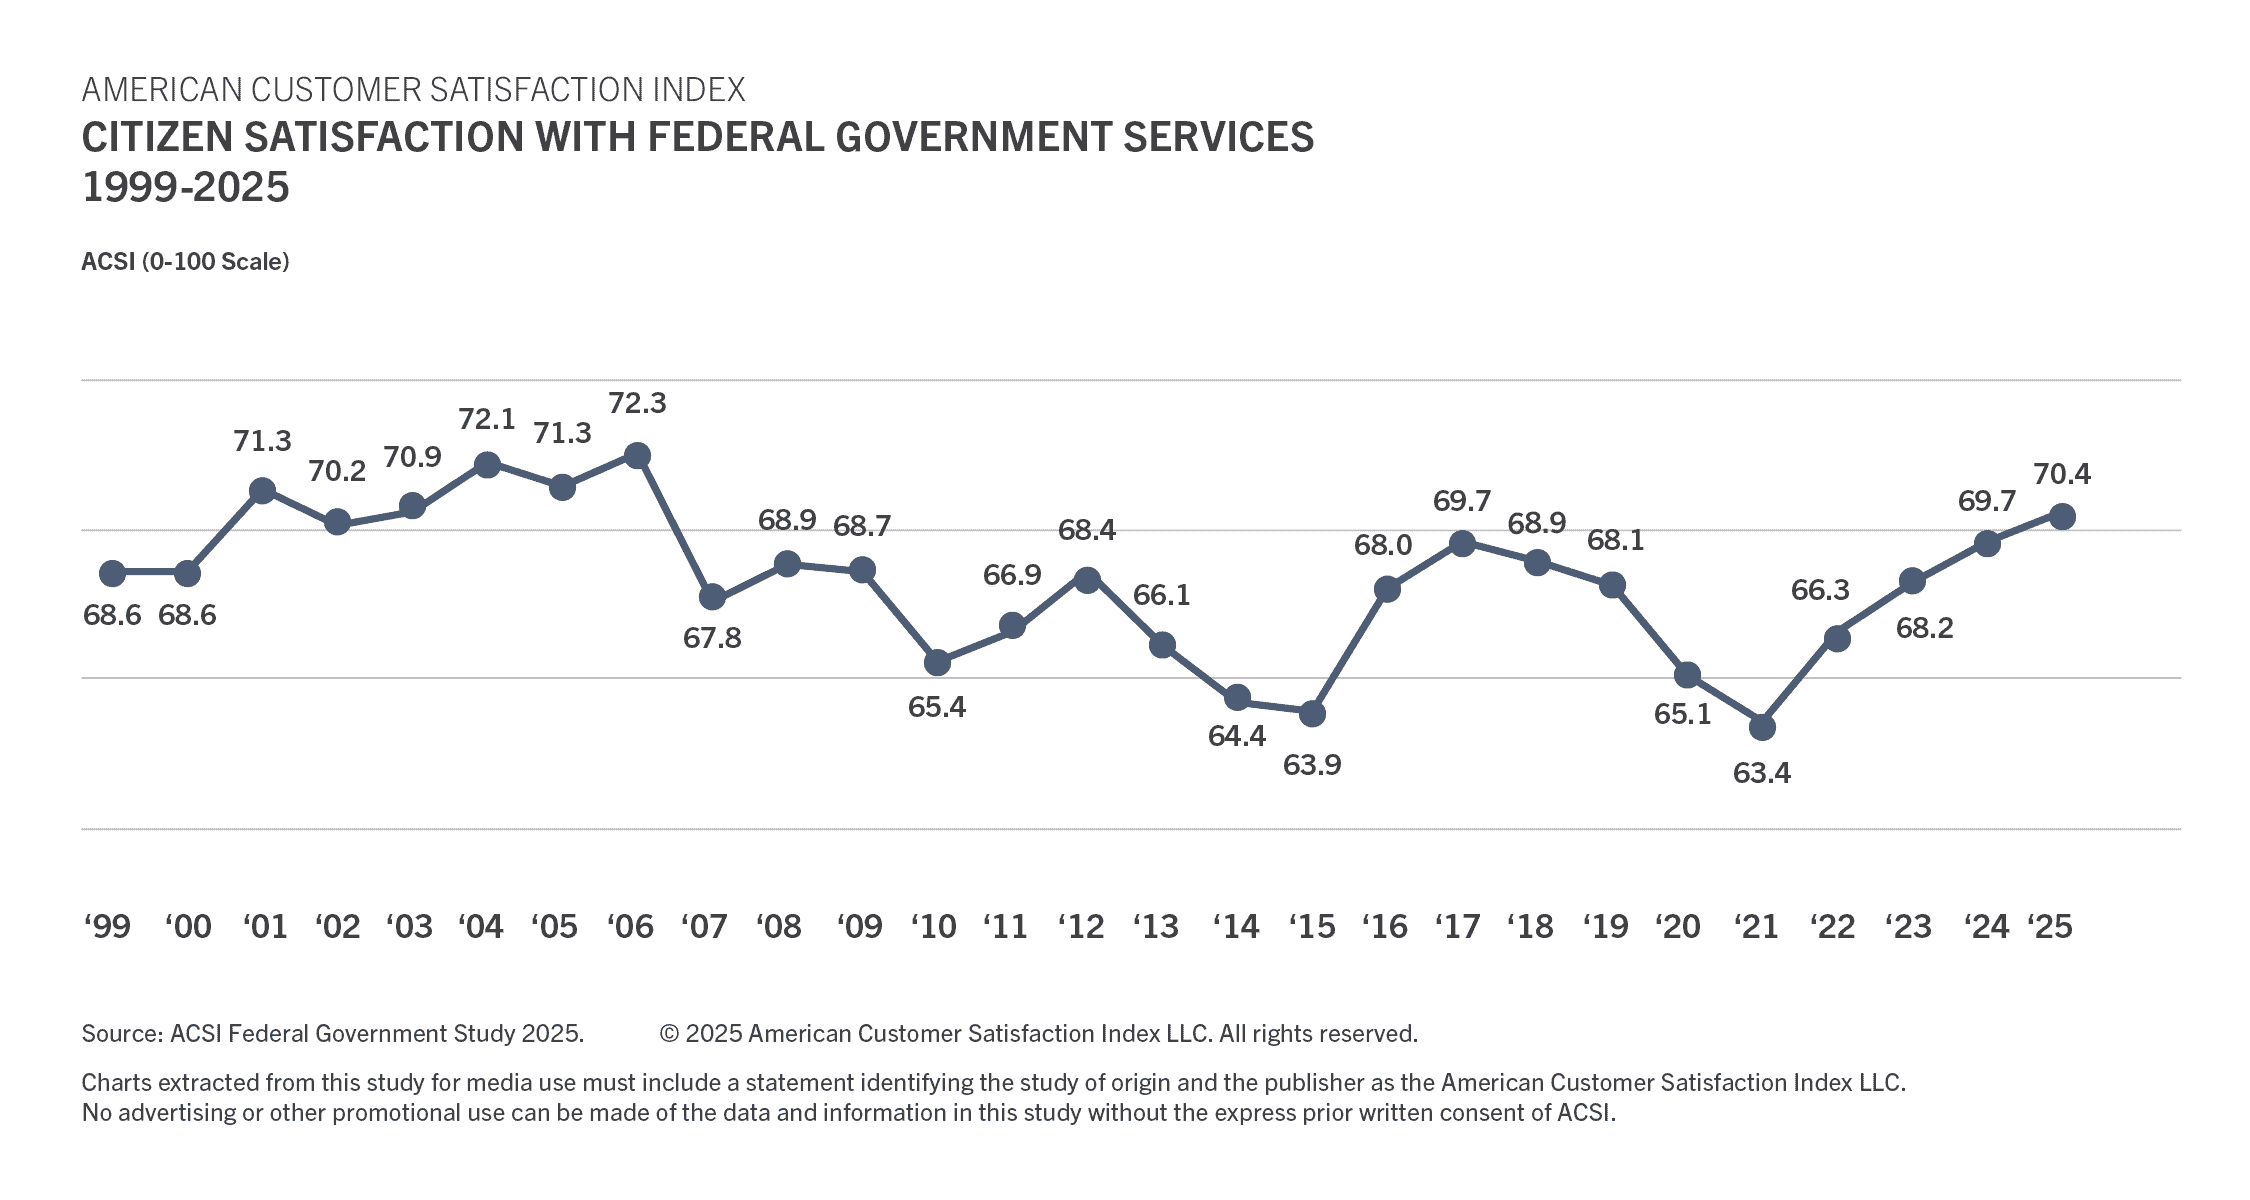
The ACSI measures government agencies, companies, industries, and sectors annually, with new data replacing data from prior years. This allows government entities to track user satisfaction with the quality of their services over time and compare these results to other organizations in both the private and public spheres.
Sector: Government Benchmarks
For both government and private-sector measurement, the ACSI uses customer interviews as input to a multi-equation econometric model. Customers’ responses about a government agency are aggregated to produce its ACSI benchmark, thus results are specific to each individually measured organization. Because most agencies do not deal in economic transactions in a strict sense, the ACSI government model includes outcomes appropriate to the public sector in lieu of price-related measures.
ACSI Government Model
The ACSI model is a cause-and-effect model with indices for drivers of satisfaction on the left side, satisfaction (ACSI) in the center, and outcomes of satisfaction on the right side. As seen in the diagram, the ACSI government model (used for most agencies) is identical to the private-sector model with a key modification in the “outcomes” component. Specifically, the outcome of citizen trust replaces the price-related outcomes found in the private-sector model (repurchase intention and price tolerance).
Because agencies provide services with little or no direct charge to the user, perceived value is not part of the government model. The drivers of expectations and perceived quality, satisfaction, and the outcome of customer complaints appear in both the government and private-sector models.
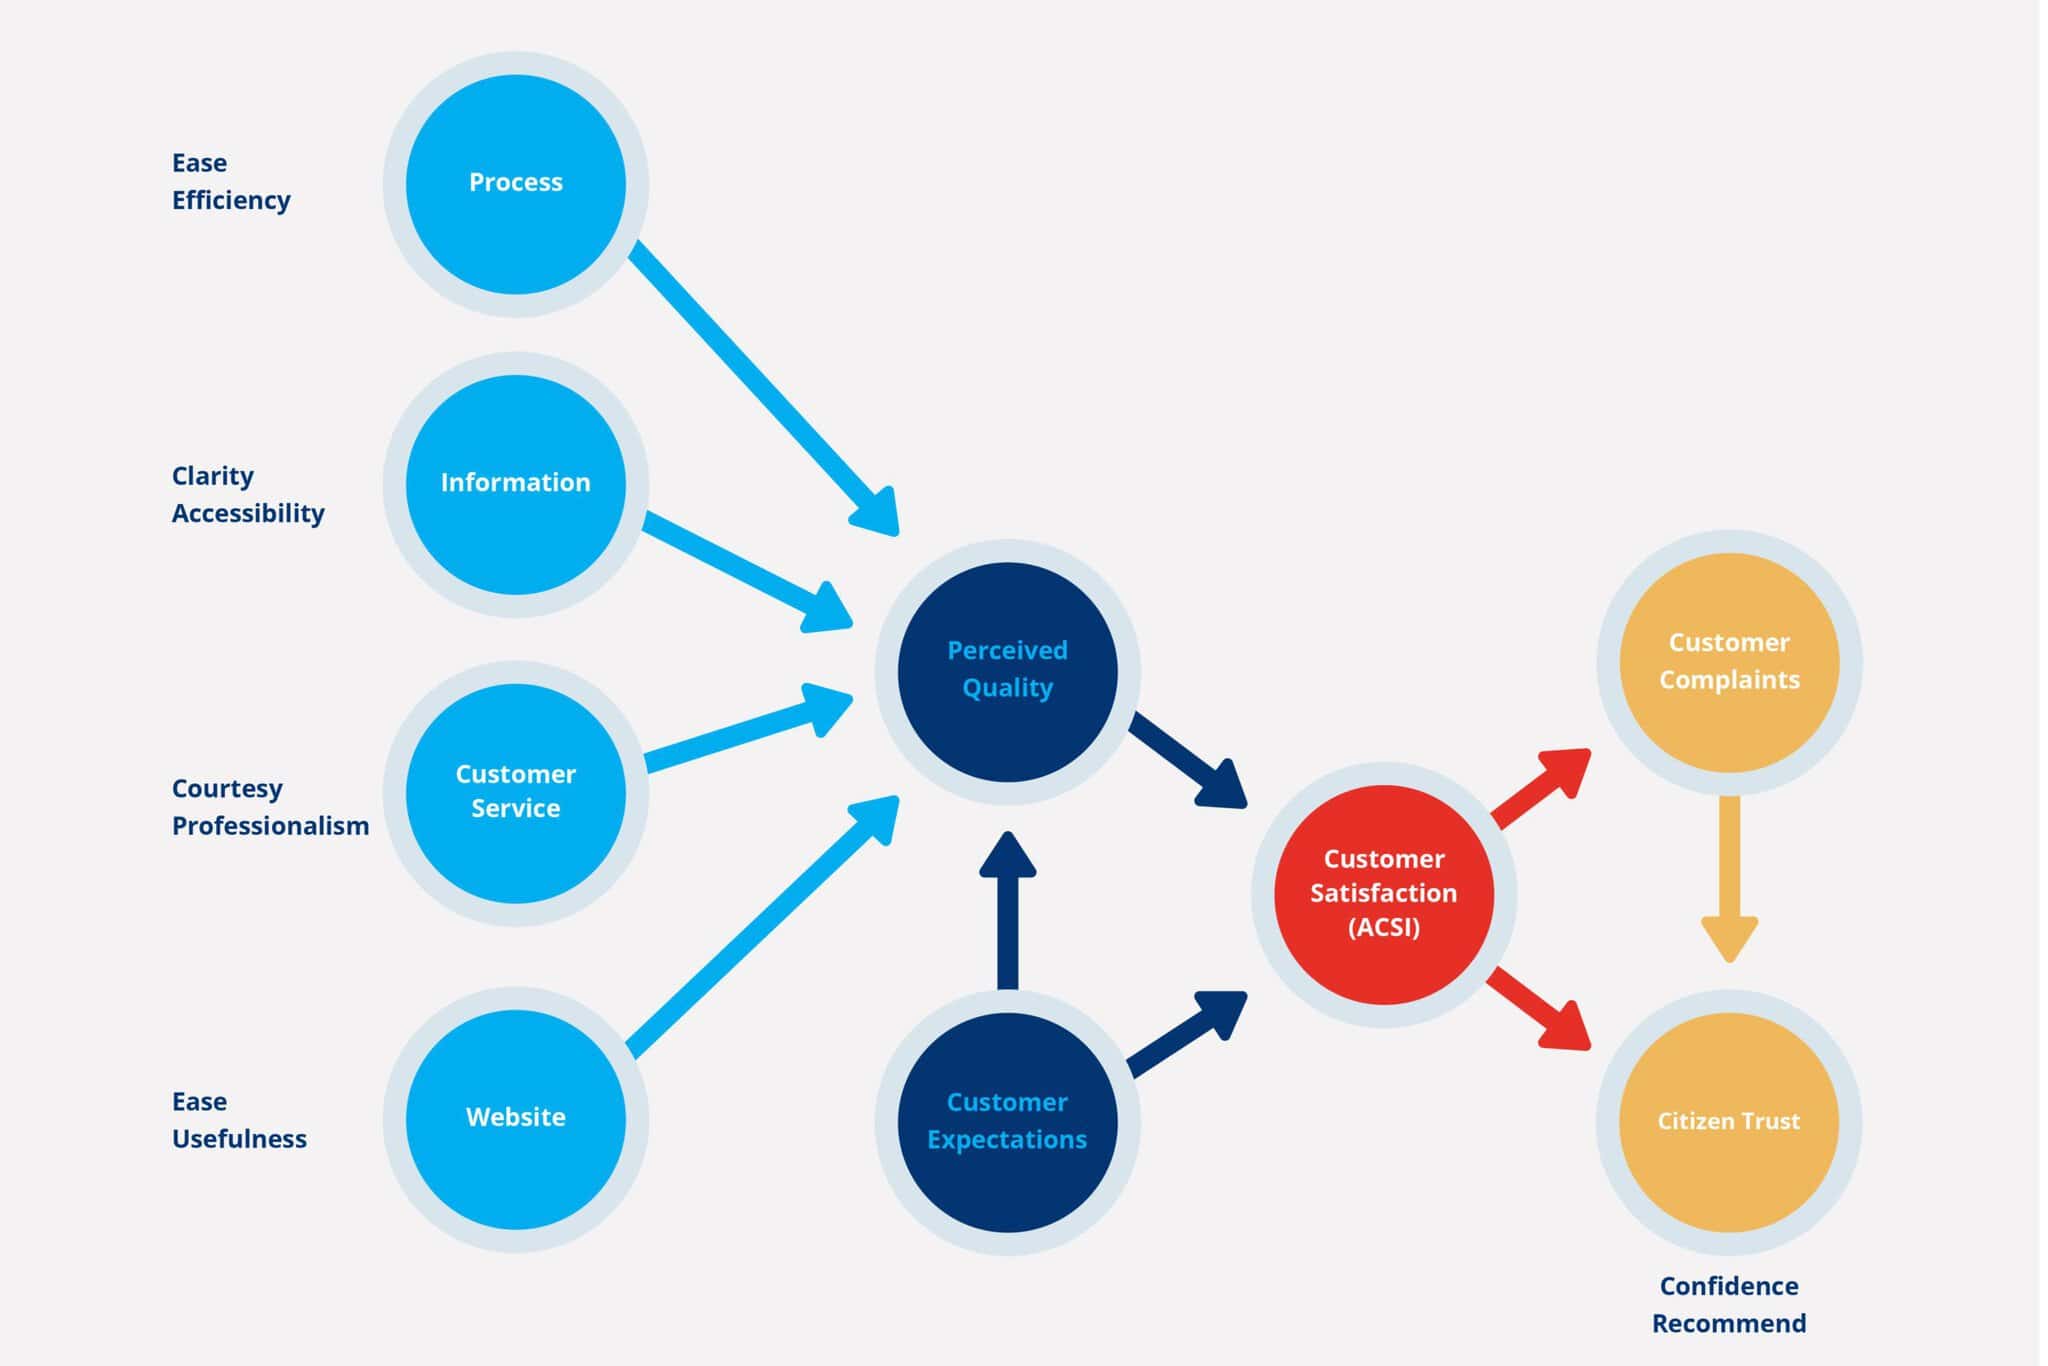
For government organizations, indicators of satisfaction are grouped into four broad categories that are used as input to measure quality (process, information, customer service, and website).
For the outcome of citizen trust, indicators are (1) the degree to which the user/customer would recommend the agency’s services to others (recommend) and (2) the extent to which the user has confidence in relying on the agency in the future (confidence).
No advertising or other promotional use can be made of ACSI data and information without the express prior written consent of ACSI LLC.